
Top 5 Mathematical Indicators Every Football Analytics Specialist Tracks
In contemporary football analytics, analyzing past scorelines alone is one of the most deceptive methods for predicting future sporting events. A team can win 1-0 via an unrepeatable 35-yard deflected strike while conceding seven clear-cut opponent chances. Conversely, a dominant side can suffer an unlucky 0-1 defeat despite recording an overwhelming shot differential and hitting the woodwork three times.
To uncover genuine mathematical value on the 8XBet Nigeria Sportsbook, professional analysts bypass surface-level final scores. Instead, they construct empirical forecasting frameworks grounded in underlying probabilistic distributions. Whether you are placing single wagers or computing multi-leg selections on our Acca Calculator, integrating quantitative indicators into your match evaluation routine is the key distinction between casual speculation and structured value investing.
—
1. Expected Goals (xG) and Non-Penalty Expected Goals (npxG)
Expected Goals (xG) quantifies the probability of any given shot culminating in a goal based on historical shot trajectory databases comprising hundreds of thousands of historical attempts. The metric factors in crucial contextual parameters:
- Distance to Goal Line: Distance from goal inversely correlates with conversion probability exponentially.
- Shot Angle: Central shooting vectors yield higher conversion rates than acute angles near the touchline.
- Body Part & Delivery Type: Footed shots from open play crosses possess different scoring distributions compared to contested headers.
- Defensive & Goalkeeper Proximity: The density of defenders obstructing the shooting corridor directly suppresses xG value.
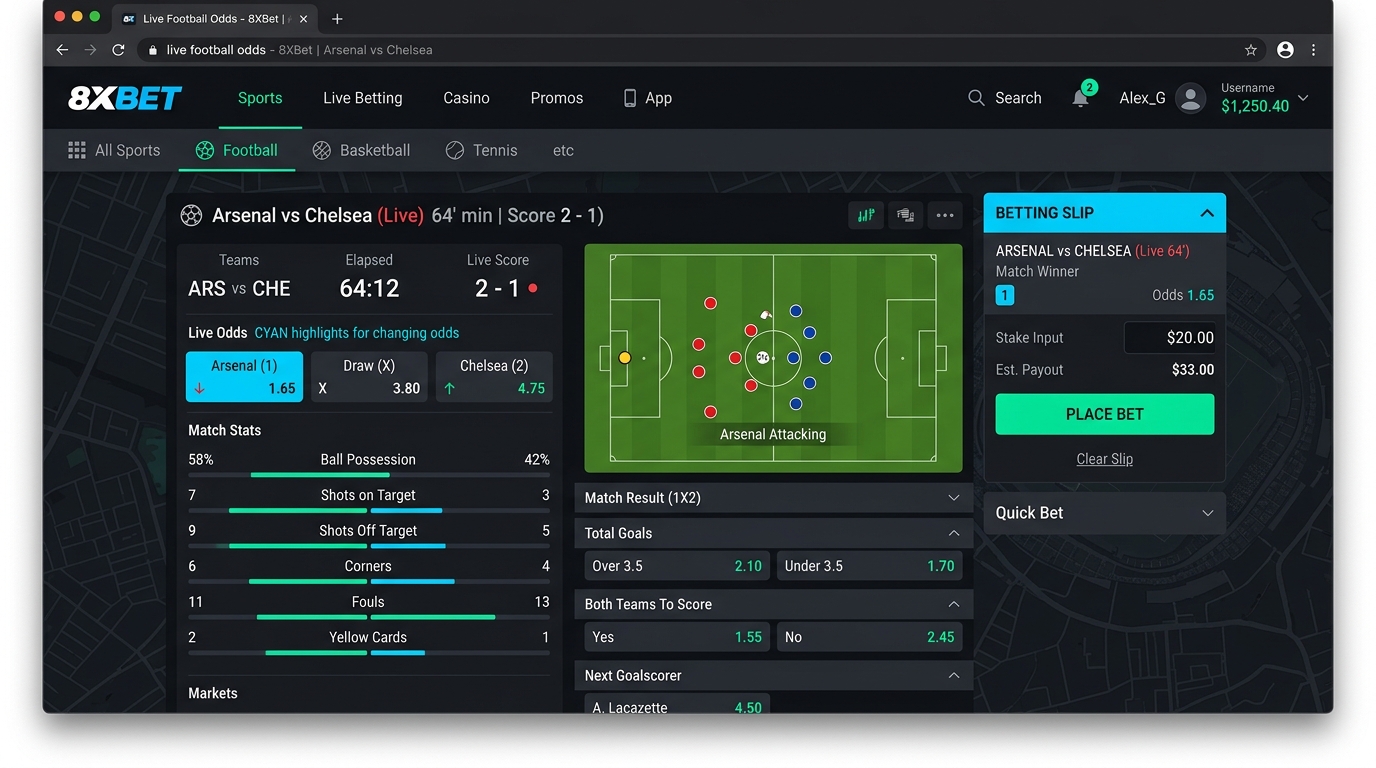
!Tactical Match Statistics & Odds

Why Non-Penalty xG (npxG) Matters Most
A penalty kick carries a standardized xG coefficient of 0.76 (76% historical conversion rate). When evaluating a striker's true open-play finishing or a team's tactical potency, including awarded penalties distorts underlying chance creation.
If Team A generates 2.40 xG with two penalties included, their open-play creative baseline is actually 0.88 npxG. If Team B generates 2.10 npxG entirely from open play, Team B represents the superior offensive system. When exploring Premier League Predictions, always reference npxG differentials to pinpoint teams destined for mean regression.
| Metric Component | Standard Final Score | Expected Goals (xG) Framework | Strategic Implication for Bettors |
| :— | :— | :— | :— |
| Luck & Deflections | Weighted equally as skill | Excluded / Down-weighted | Identifies overperforming teams due for regression |
| Game State Variance | Ignored in standard tables | Accounted for in rolling models | Adjusts xG output when trailing vs protecting a lead |
| Goalkeeper Shot-Stopping | Conflated with defensive errors | Isolated via Post-Shot xG (PSxG) | Spots world-class shot stoppers preserving points |
| Predictive Power | Moderate (r ≈ 0.38) | High (r ≈ 0.69) | Delivers edge over bookmaker opening pricing |
—
2. Passes Per Defensive Action (PPDA) and High Turnover Pressing
While xG measures offensive execution, Passes Per Defensive Action (PPDA) provides an empirical index of a squad's defensive pressing intensity in the opposition's defensive two-thirds of the pitch.
$$ ext{PPDA} = rac{ ext{Opponent Passes Allowed in Defensive Zone}}{ ext{Defensive Actions (Tackles + Interceptions + Challenges)}}$$
- Low PPDA (< 9.0): Denotes an aggressive, high-energy counter-pressing system (e.g., modern pressing setups).
- High PPDA (> 15.0): Indicates a passive low-block defensive scheme that concedes possession and protects the penalty box.
Exploiting PPDA Mismatches in Live Betting
When a low-PPDA pressing powerhouse encounters a technical team lacking press-resistant deep midfielders, defensive turnover rates skyrocket. These situations frequently trigger transition goals within 5 to 8 seconds of possession loss. If you monitor Live Football Scores & Odds, tracking live PPDA shifts reveals impending momentum swings 15 minutes before the goal arrives.
Before placing in-play wagers, ensure your account is funded smoothly via the OPay & PalmPay Naira Deposit Guide to capitalize on dynamic in-play odds shifts.
—
3. Field Tilt and Territorial Possession Dominance
Possession percentages can be misleading. A team can register 65% ball possession by passing horizontally across their center-backs without penetrating dangerous territory.
Field Tilt corrects this flaw by calculating a team's share of total passes in the final third:
$$ ext{Field Tilt} = rac{ ext{Attacking 3rd Passes Completed by Team A}}{ ext{Total Attacking 3rd Passes Completed by Both Teams}} imes 100%$$
When a squad records 68% Field Tilt alongside a 1.80 xG rate but trails 0-1 due to an isolated counter-attack, backing them on the in-play Draw No Bet or Asian Handicap line represents a mathematically sound +EV decision.
—
4. Shot Conversion Efficiency & Post-Shot xG (PSxG)
Post-Shot Expected Goals (PSxG) measures the probability of a shot resulting in a goal *after* the ball leaves the striker's boot, taking into account exit trajectory, velocity, and placement within the goal frame.
- PSxG vs xG Differential: A positive differential indicates elite shot placement into the top corners.
- Goalkeeper PSxG Differential: If a goalkeeper's goals conceded are substantially lower than the PSxG faced, that goalkeeper is performing at an elite shot-stopping level.
- Regression Modeling: Extreme conversion rates (e.g., scoring on 28% of total shots over 5 matches) almost always regress toward the league median of 9.5% to 11.2%.
You can quantify how these mathematical differentials affect return on investment with our interactive Betting Odds Calculator and Implied Probability Calculator.
—
5. Bivariate Poisson Distribution & Goal Probability Modeling
To construct custom fair odds and compare them against bookmaker lines on 8XBet Nigeria, analysts apply Poisson distribution modeling. Because football goals represent discrete events occurring within a fixed 90-minute time window, the probability of a squad scoring $k$ goals is calculated as:
$$P(k ext{ goals}) = rac{lambda^k e^{-lambda}}{k!}$$
Where $lambda$ represents the team's attack strength multiplied by the opponent's defensive vulnerability factor.
Worked Example: Fair Odds Calculation
Suppose our mathematical modeling establishes:
– Home Team Expected Goal Value ($lambda_{ ext{home}}$) = 1.75
– Away Team Expected Goal Value ($lambda_{ ext{away}}$) = 0.95
Using bivariate Poisson matrix computation, the probability distribution produces:
– Home Win Probability: 54.2% (Fair Decimal Odds = 1.85)
– Draw Probability: 24.6% (Fair Decimal Odds = 4.06)
– Away Win Probability: 21.2% (Fair Decimal Odds = 4.72)
– Over 2.5 Goals Probability: 52.8% (Fair Decimal Odds = 1.89)
If the 8XBet market lists the Home Win at 2.10, the positive expected value (+EV) is calculated as:
$$ ext{EV} = (0.542 imes 2.10) – 1 = +13.82%$$
Securing a consistent +13.8% edge over market pricing compound bankroll growth sustainably over hundreds of wagers.
—
Practical Staking Strategy and Bankroll Protection
Even the most advanced mathematical models experience short-term variance. To protect capital against prolonged losing streaks:
- Apply Fractional Kelly Staking: Never wager more than 1.5% to 2.5% of total bankroll on a single match.
- Maintain Account Verification: Verify your player identity ahead of time using our 8XBet Account Verification Guide for immediate withdrawal clearance.
- Leverage Welcome Incentives: Activate promotional bonus capital through the 8XBet Promo Code Nigeria Guide to reduce personal risk on initial modeling trials.
- Adhere to Responsible Principles: Review the Responsible Gambling Policy to maintain strict staking limits and emotional discipline.
Related Resources & Guides on 8XBet Nigeria
- Create Your 8XBet Nigeria Account
- 8XBet Mobile App Download for iOS & Android
- How to Play & Place Your First Bet Slip
- Is 8XBet Legal and Safe in Nigeria?
- Football Betting Academy & Strategy Hub